TEMPERATURE MONITORING WITH SATELLITE DATA
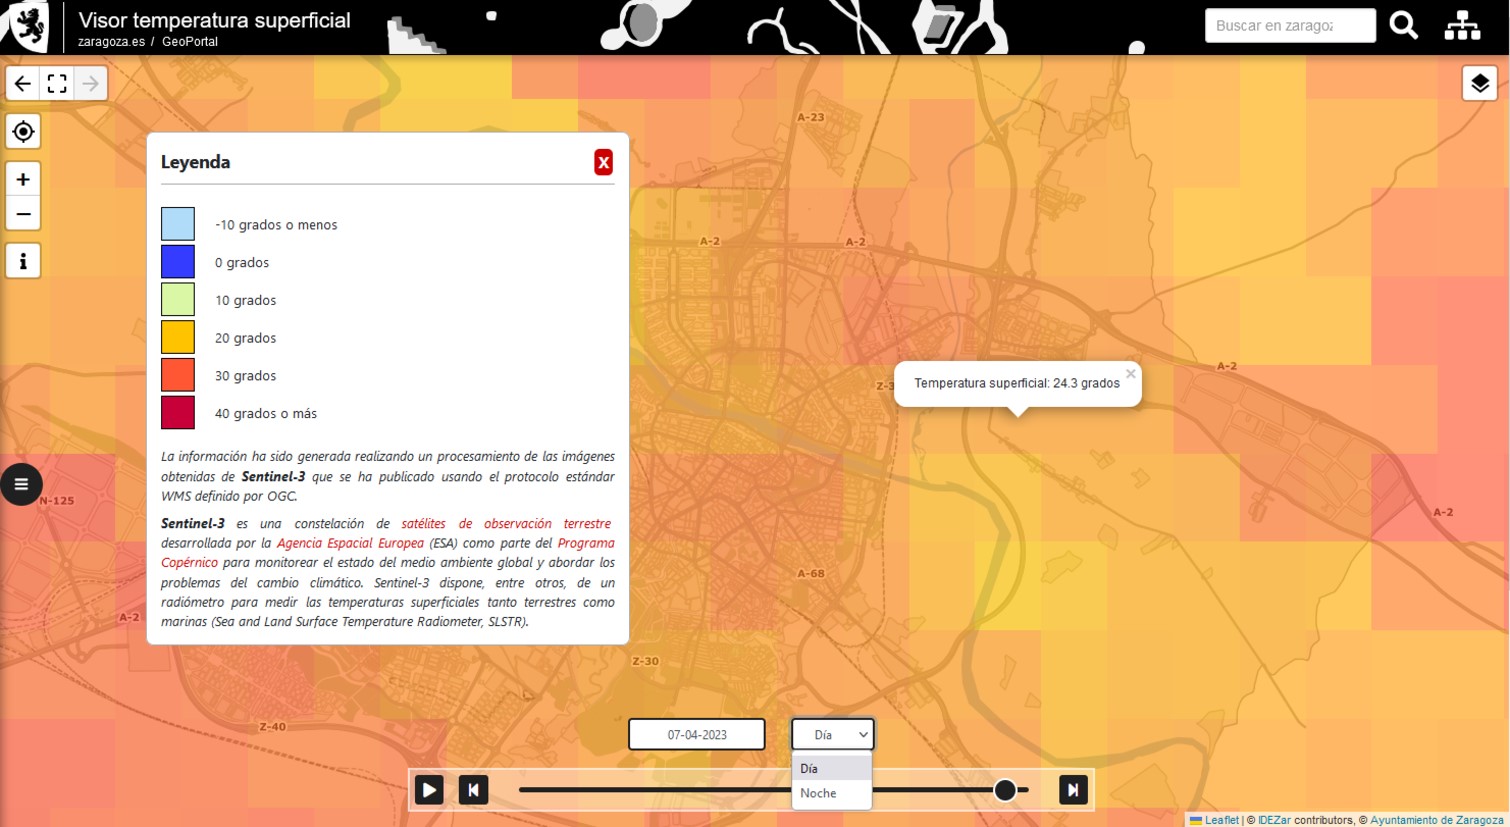
From today, the electronic headquarters of the Zaragoza City Council offers a new visualization service that allows to know the surface temperature of the city thanks to the information provided by the Sentinel satellite.
The surface temperature is a good complement to the ambient temperature in the city because it is conditioned by the material and type of soil, vegetation cover, etc. This is very interesting for decision making by municipal managers (urban planning, environment, etc.).
The information has been generated by processing images obtained from the Sentinel-3 satellite and published using the standard WMS protocol defined by the Open Geospatial Consortium (OGC).
Sentinel-3 is a constellation of Earth observation satellites developed by the European Space Agency (ESA) as part of the Copernicus Program to monitor the state of the global environment and address climate change issues.
One of the main advantages of this method of obtaining data over traditional temperature measurements is that it does not require the installation of any type of measuring equipment and is sensitive to environmental aspects (vegetation, soil, humidity).
The visualization tool displays a 1kmx1km grid with surface temperature values in degrees Celsius (ºC) for the selected day, which is a sufficient resolution to be able to draw conclusions at a neighbourhood level regarding heat islands in the city and other temperature-related indicators.
The main functionalities of the viewer are:
- Date selector to choose the day to display by means of a calendar
- Possibility to choose between day or night temperature (since the satellite offers information of two daily passes)
- Query of the specific surface temperature value in degrees Celsius by maptip[1] when clicking on a point on the map
- Possibility to navigate between dates to display data from previous or subsequent days with animated navigation option
This viewer has been developed by Geoslab based on its experience in the development of remote sensing technology applied to the agricultural environment (i.e.: https://www.geoslab.com/en/id-projects/remote-sensing-platform/ and https://www.geoslab.com/en/our-projects/agroslab/)
Data for 2021, 2022 are currently available and data for 2023 are being incorporated monthly.
The historical data will make it possible to offer, in the medium term, comparisons by period or other types of functionalities and indicators.
This initiative is part of the European project Urban Data Space for Green Deal (USAGE), in which Zaragoza City Council participates, which aims to provide solutions and mechanisms to make environmental and climate data of cities available to citizens.
In the media:
[1] A maptip is an informational message that appears when a user hovers over a feature, surface or raster image. The purpose of a maptip is to provide useful content, such as additional attributes, data, or images.


